Static preview. Click to explore the full interactive dashboard.
Rural Leadership Dynamics
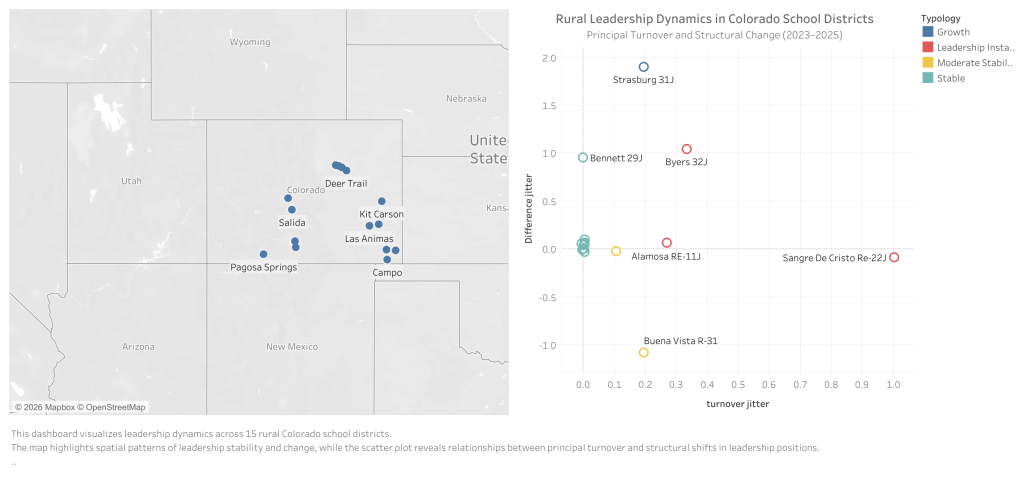
The interactive dashboard studies leadership changes in certain rural Colorado school districts by combining principal turnover rates with changes in leadership roles. Instead of using a single measure, the dashboard provides a clear picture of different patterns of leadership stability, growth, and change. This method helps us better understand how leadership changes in rural areas, where even small staff changes can have big effects.
The typology moves beyond traditional retention or turnover measures by integrating two dimensions: turnover rate and change in leadership headcount. This approach distinguishes between stable systems, growth patterns, and various forms of instability, providing a more comprehensive interpretation of leadership change in rural districts.
| Turnover Rate Range | Difference Range | Turnover Levle | Difference Type | Typology | Label Description |
| <10% | -1 to +1 | Low | Stable | Stable | Low turnover with no structural change |
| <10% | >=2 | Low | Expanding | Growth | Low turnover with increasing leadership positions |
| 10%–20% | -1 to +1 | Moderate | Stable | Moderate Stability | Moderate turnover with stable structure |
| >20% | -1 to +1 | High | Stable | Leadership Instability | High turnover without structural change |
| =10% | <=-2 | Moderate /High | Contracting | Disruptive | Turnover with decreasing leadership positions |
| 20% | >=2 | High | Expanding | Restructuring | High turnover with expansion and replacement |
Key Insights:
- Most sampled rural districts exhibit high levels of structural stability, with no change in leadership positions and low or zero turnover rates.
- Leadership instability can occur even without structural change, indicating that turnover alone may not reflect deeper organizational shifts.
- Small and very small districts show amplified effects of personnel changes, where a single departure or hire can significantly influence turnover rates.
- A small number of districts demonstrate growth patterns, where new leadership positions are added alongside moderate turnover, suggesting possible expansion or restructuring.
- The clustering of multiple districts at identical values (e.g., zero turnover and no structural change) highlights the importance of visualization techniques such as jitter to reveal underlying distribution patterns.
